Statsig MCP v3 Cuts Agent Tools From 93 to 18
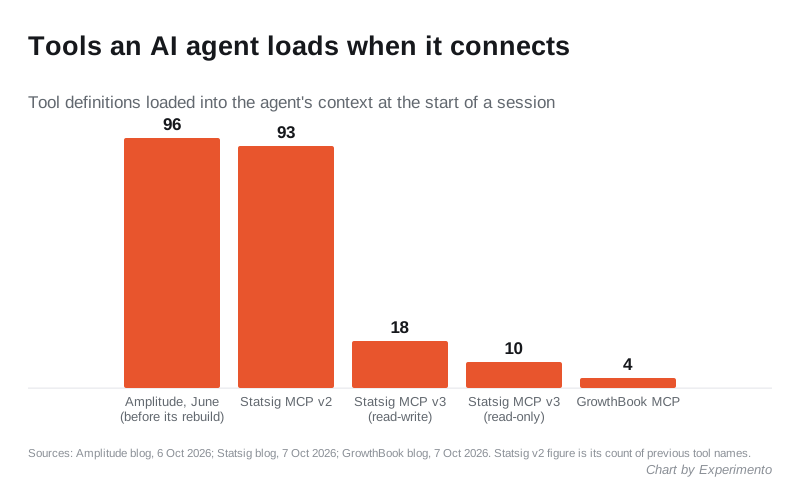
Three experimentation vendors published within two days of each other this week, and all three said the same thing: the MCP servers they built for AI coding agents had grown too big, and the fix was fewer tools, not more. If your team checks flags or experiment results from a coding agent, this changes what it costs you to keep those connections switched on.
Statsig MCP v3: 18 tools at start-up instead of 93
On 7 October Statsig, now part of Amplitude, launched version 3 of its MCP server. Version 2 loaded every tool definition into the agent’s context at the start of every session, whether or not the session touched Statsig. Version 3 starts a read-write session with 18 tools and a read-only session with 10, covering gates, experiments, dynamic configs, metrics, audit and logs, and search, and reaches the rest on demand. Statsig says all 226 endpoints in its managed Console API scope are now covered, and that in its internal testing input tokens fell by roughly 43% on an equivalent set of tasks.
The change most teams will care about is permissions. Read-only used to be one switch for a whole project, so many teams turned agent writes off entirely. With personal keys, v3 combines the owner’s role with the project maximum and the token scope, so a platform team can be allowed to change flags while everyone else reads. Tools a caller is not allowed to use do not appear in the session at all.
If you already use v2, this is a full rebuild: you have to reauthenticate, the 93 old tool names have changed, and automation should read the new structured output rather than parsing text. Statsig says v2 will keep running unchanged for a few months, so there is no need to switch mid-test. Details on the Statsig blog.
Amplitude: 96 tools used 57% of a customer’s context window
A day earlier, on 6 October, Amplitude published what it learned from consolidating its own MCP server. By June, connecting to it loaded 96 tools, mostly one per API endpoint. The wake-up call was a customer on a 200K context window: listing Amplitude’s tools used 57% of it before a single call was made. Amplitude replaced groups of endpoint tools with one tool per object (cohort, chart, dashboard, flag), so cohorts went from nine tools to one, and moved long instructions into 37 skills that load only when a task needs them.
Its usage data is the useful part for anyone judging an agent integration. Charts used to take three chained tool calls; of 18,703 users who queried data, 20% went on to render a chart and fewer than 5% saved it. After the rebuild, 67% of external users came back after one week, 59% after four and 50% after eight. When you evaluate any vendor’s agent tooling, ask what its server costs in context before you have done anything, because that cost is paid on every session. Read it on the Amplitude blog.
GrowthBook: four tools, with the know-how in skills
On 7 October GrowthBook described the thinking behind its rebuilt MCP server, which exposes just four tools: list skills, read a skill, read the API and write to the API. The judgement about how to use the product lives in around 30 open-source skills, and the server loads them as needed. One example is its experiment-brainstorm skill, which reads up to 50 stopped experiments and requires the agent to cite past tests by name when proposing a new one.
That last detail is the one worth copying, whatever tool you use. An agent that suggests tests without reading what you have already run will happily repeat a loser. Grounding ideas in your own history is the same discipline as a written CRO hypothesis framework, and it is part of what keeps a CRO programme from relearning old lessons. The splitting of reads from writes also gives agent clients a clear signal about which calls change state. See the GrowthBook blog.
LaunchDarkly documents a full setup for Redshift experiments
LaunchDarkly’s documentation changelog records that on 7 October it updated its Redshift native Experimentation topic to cover the full-page setup, including optional custom names for the database, schema, group and users that its setup scripts create. Redshift native Experimentation lets LaunchDarkly read experiment metrics straight from your Amazon Redshift warehouse rather than from SDK events.
For teams whose security reviewers insist on their own naming conventions in the warehouse, being able to rename the objects before running the scripts removes a common reason a warehouse-native trial stalls. Our A/B testing tools comparison covers which platforms work warehouse-native. The setup guide is in LaunchDarkly’s docs.
More from Experimento
related resultsBest A/B Testing Tools in 2026, Compared by What They Actually Do
A practical 2026 comparison of the best A/B testing tools by what each one is actually good at, from Optimizely and VWO to GrowthBook and PostHog.
read result →A/B Testing Tools Compared: Which Platform Fits Your Team
A/B testing tools compared for 2026: VWO, Optimizely, AB Tasty, Convert, GrowthBook, Statsig and PostHog, matched to marketing, CRO and engineering teams.
read result →Data-Driven Design: Let Research Guide Your Product Decisions
A practical guide to data-driven design: how to pair analytics with user research, run honest tests, and make product decisions on evidence, not opinion.
read result →